Diagram Language
TL;DR
We are not artists but engineers. why don't we use a diagram as a language?
You don't need to be a designer. C4 Diagrams provide a simpler and more focusing on an architecture.
Background
There are some diagram languages for visualizing software components. But, I've extended most popular tools in the dacusaurus engine.
- Mermaid
- Plantuml
- Kroki (for C4, Structurizr and D2 extension)
There is no standard tools so it can be hard to decide which one is best. They have pros and cons. I think we can select based on your purpose. Mermaid is easy to understand and more simple notation. Plantuml is more complex but can make software components like UML. In the Kroki, I added C4 and D2 which is more specific for software architeture.
In this document, I'll explore C4 diagrams which is offering the necessary leve of detail for most software development.
C4
C4 stands for Context, Container, Component and Code Diagram. It's a set of hierarchical diagrams that represent the different levels of abstraction of a software system.
Diagram Notation
- Person -
Person(alias, "label", "desc")Element presenting users or roles of a software system - Software system -
System(alias, "label", "desc"),System_Boundary(){ }Topmost level in abstractions that represent the value of existing systems or systems under development and the interaction between those systems - Container -
Container(alias, "label", "tech", "desc"),Container_Boundary() { }Element representing the internals of software systems; usually applications or solutions for data storage. A different concept to containers in Docker. The examples of a container are servers or client applications (for example, web, mobile, or PC), CLI applications, batch processes, databases, blob storage, file systems, or shell scripts. It mainly refers to a software that is independently deployed. - Component -
Component(alias, "label", "tech", "desc")Abstraction element representing the internals of the container of such modules or a set of interfaces that can be grouped as a functional unit. In Java or C# terms, they can be seen as a set of classes implemented for interfaces or packages. They differ from containers as these cannot be deployed independently. - Relations Representing dependencies or data flow between abstraction elements
Level 1: Context diagram
It shows the high-level relationships between the system and the people, systems, and external entities that interact with it.
Level 2: Container diagram
This diagram zooms into the system and shows its major software or hardware components (containers), such as web servers, databases, desktop applications, mobile apps, etc. The Container Diagram provides a more detailed view of the system's architecture, but still remains high-level enough to be easily understood by non-technical stakeholders.
Level 3: Component Diagram
It breaks down each container into its constituent components, showing their interactions and relationships. Components could be classes, interfaces, or larger chunks of code that provide a specific functionality. This diagram is highly useful for developers as it gives a detailed view of the system's internal structure.
Level 4: Code Diagram
The final level of abstraction is the Code Diagram. This diagram dives into the details of individual components, showing the important classes, interfaces, and their relationships. It represents the lowest level of abstraction and is typically used by developers for designing and implementing the system.
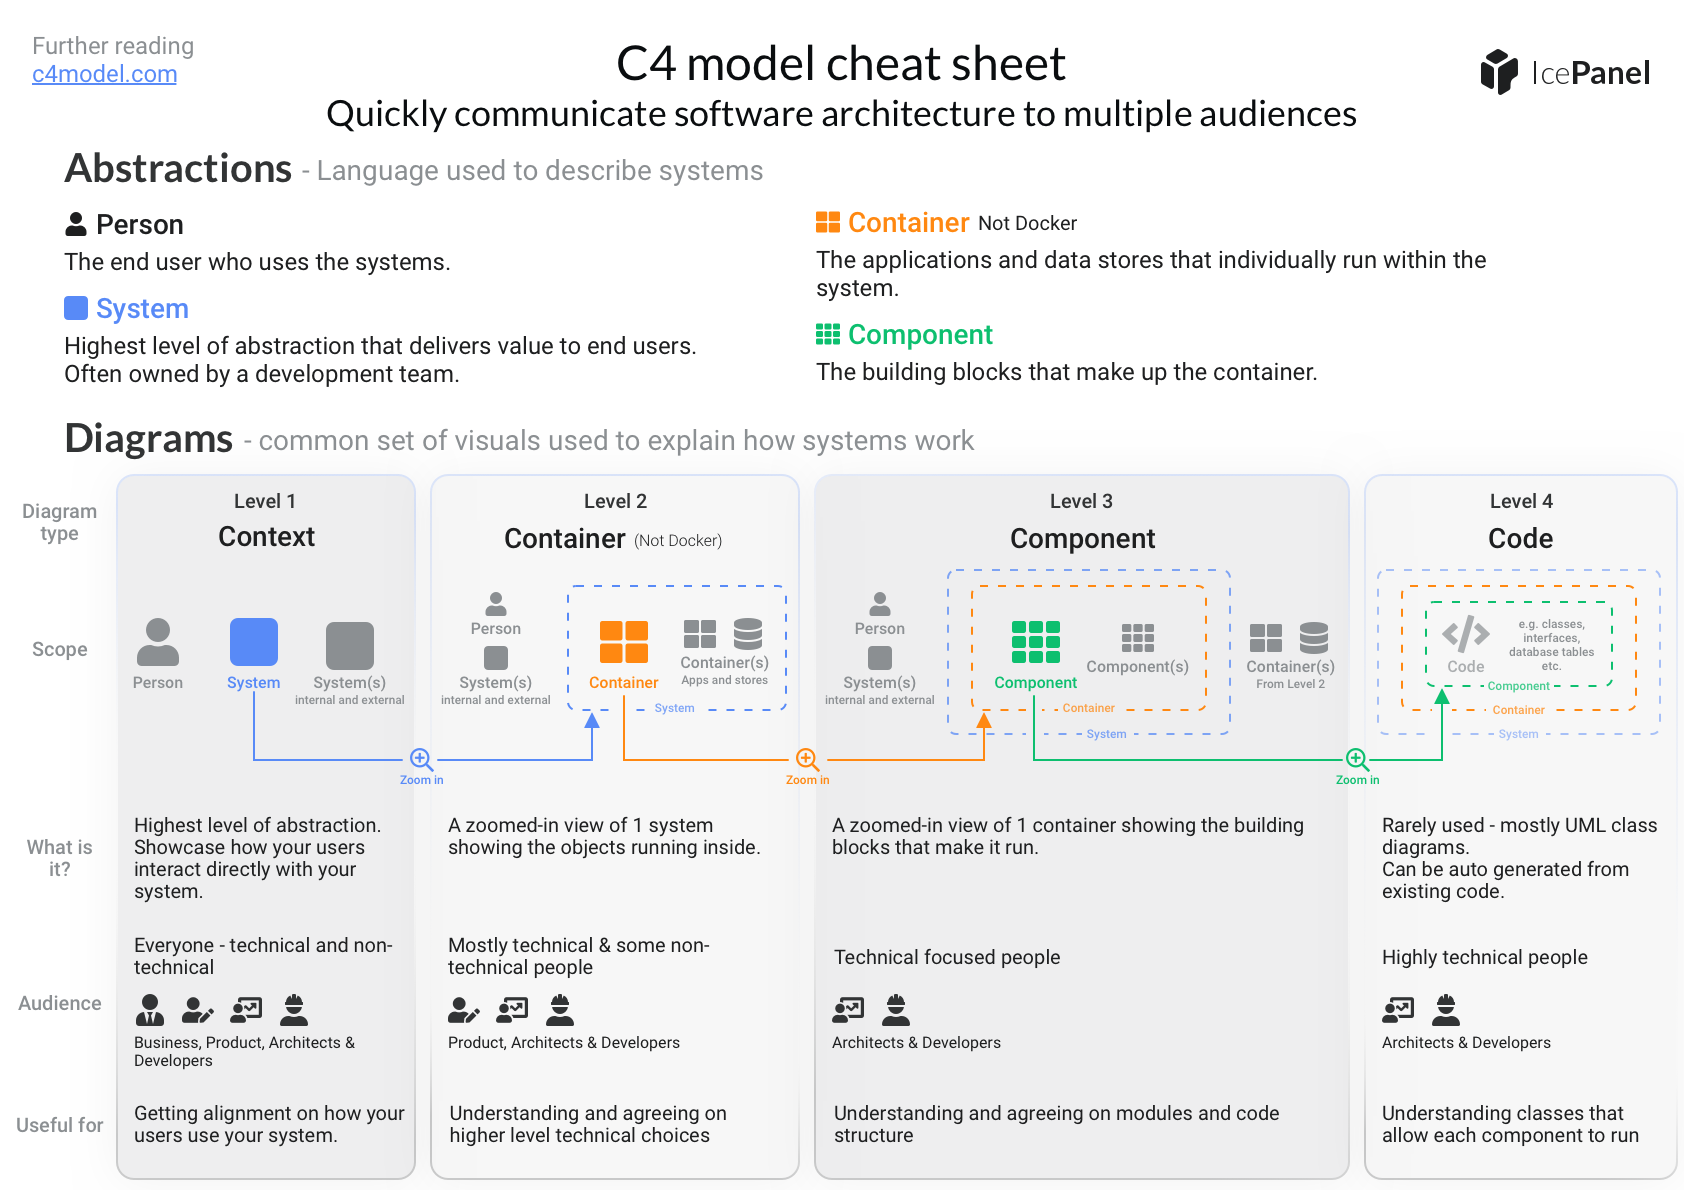
Ref. icepanel.io
Diagram Guidelines
- Give a
titleto the diagram and indicate the level of the diagram. - Show a key/legend
- Be wary of using acronyms or initials
Element Notations
- Be explicit about the type for all elements
- Add a short description for all elements
- Include adopted or base technology for containers and components
Relations
- Favor uni-directional lines
- Add a short description for all lines
- Include a technology or protocol used to exchange data between containers
Keep it Simple!
Remember that your diagram may be used by various stakeholders, not all of whom may have the same technical knowledge.
Avoid overcrowding your diagram with excessive details. While it's essential to provide a comprehensive view, too much information can be overwhelming and obscure the main points.
Use Consistent Notation
Consistent notation is key to avoiding confusion and ensuring smooth communication. Decide on a set of symbols and conventions, and stick to them throughout all your diagrams.
Keep Diagrams Up-to-Date
Your diagrams should accurately reflect the current state of your system. As such, keeping them up-to-date is crucial. Using C4 tools can make this much easier.
As your system evolves, so should your diagrams. Regularly revisit and revise your diagrams to ensure they mirror any changes or updates. This practice not only maintains the accuracy of your diagrams but also enables a better understanding and tracking of your system's evolution.
Ensure consistency in your diagrams, as the predefined notations and standards are maintained accross all diagrams.